This is the second post I am writing to discuss about a series of experiments. The first post tries to answer what happens to a model after RL. This post focuses on another question - How much can RL extract from a model, and is that amount already fixed by what pretraining supplied?
The question comes from an observation(mentioned in the first post) that in the last 20 updates of my runs, around 53% of GRPO groups returned identical rewards - all G completions correct, or all G wrong. Identical rewards mean zero advantage, zero gradient, no learning. The all-correct case indicates nothing left to improve, and the all-wrong case indicates that the model is not sampling anything to reinforce on(neither positive nor negative), for learning correct behaviour, there should at least be one correct completion in the G(8 in my case). If that is the mechanism, then RL can only ever reinforce what the base model already reaches within G tries.
To actually test it, I need to vary what pretraining supplied while keeping everything about RL identical, rerun pretraining itself many times, changing only how much of the target task the pretraining mix contains and watch where the same RL recipe takes us. On a real LLM, rerunning pretraining even twice is costly, whereas on the tiny instrument a full pretrain runs in minutes. (This was also the one experiment where I actually spent money - 18 pretrained models on modal cost about $0.8.)
The experiment: rerun pretraining itself
The previous post built a tiny instrument: a ~10M model pretrained on arithmetic, plus exact measurements around it. I will interchangeably refer to it as substrate too, and will refer to each experiment as X-something.
The first experiment used one substrate throughout, which had a ~1% target task in its pretraining data mix(the 3x3 digit addition). In this, I did a sweep across the target task fraction in the pretraining mix and pretrained multiple models/substrates.
I created 18 substrates: six settings of the target’s mixture weight - 0, 0.01, 0.03, 0.06, 0.15 and 0.5, against the six background tasks at weight 1.0 each - times three pretraining seeds per setting. In terms of what the model actually sees, those weights put the target at roughly 0%, 0.17%, 0.5%, 1%, 2.4% and 7.7% of the training stream. The 0.06 setting is the recipe from previous post(~1% of the stream) - this sweep takes the task from being very rare to being a regular part of the mix. Everything else is identical, same architecture, same 5,000 pretraining steps, same six background tasks.
Then, for each of the 18 models:
- Before RL: teacher-force the same fixed set of 2000 target problems to get each model’s exact p per problem - and from those, its exact pass@1, pass@8 and pass@64 (teacher forcing gives each problem’s exact one-try chance p, and then pass@k is just $1-(1-p)^k$ - no sampling involved; the X1 post explains this measurement).
- RL: run the identical GRPO recipe from X1 - 500 updates, groups of 8, lr 1e-5 - on each model.
- After RL: measure where it landed, on the same 2000 problems.
18 fresh pretrains, three seeds per setting, identical RL everywhere. So whatever differences show up after RL were caused by what pretraining supplied.
RL cashes in the base model’s pass@8
Each dot below is one of the 18 substrates. On the x-axis, its pass@8 before RL - the chance that a group of 8 sampled answers contains at least one correct one, computed exactly from the teacher-forced p’s. On the y-axis, where the identical GRPO recipe landed it - its mean p(correct) after RL, averaged over two RL seeds per substrate (so 36 RL runs sit behind these 18 dots). The dot’s colour is the target’s weight in that substrate’s pretraining mix, from dark (target nearly absent) to yellow (target common).
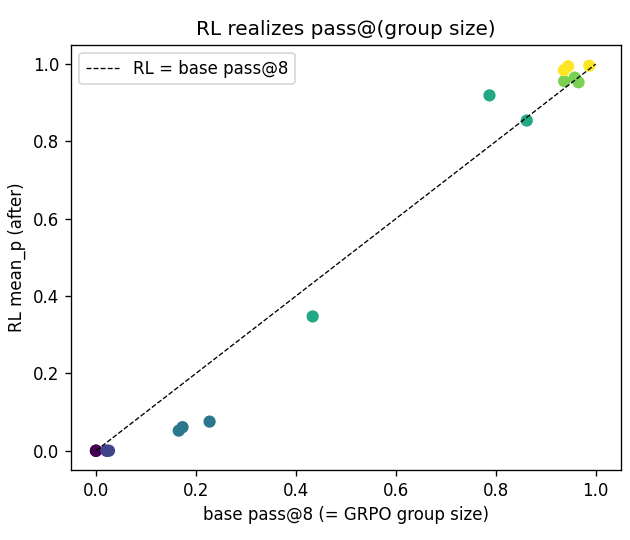
The dots sit on the diagonal - correlation 0.99. Whatever a substrate’s pass@8 was before RL, that is almost exactly its one-try accuracy after RL. To write that down I need one symbol: let p be the model’s exact chance of producing a problem’s correct answer in one try - the teacher-forced product from the first post. For 387+456= with answer 843, that is P(8) × P(4 | 8) × P(3 | 84) × P(eos | 843). With $p_{\text{before}}$ and $p_{\text{after}}$ being that quantity under the base and the tuned model, the diagonal says:
Read it as a conversion: GRPO turns “right somewhere within 8 tries” into “right on the first try” - and nothing more. Per problem, that is $p_{\text{before}}$ getting pushed toward 1 if the problem was inside the 8-try window, and staying near 0 if it was not.
And look at what the colours do: the pretraining mix decides where a substrate sits along the diagonal, but in none of the cases is the dot away from the diagonal. So the mix affects RL through the pass@8 it hands over.
Why does this happen? GRPO samples 8 answers per problem. On a problem where none of the 8 comes out correct, every reward is zero, the advantage is zero, the gradient is zero - learning on that problem never starts, this update or any other. On a problem where at least one try lands, there is a winner to push toward, and 500 updates are plenty to finish the job (X1 showed how thoroughly). Sum that over the eval set and the prediction is literally the diagonal: final accuracy = the fraction of problems the base could reach within 8 tries = pass@8.
What 64 tries could reach stays out of reach
If RL converted everything the base model could ever reach, the same diagonal should appear against pass@64 too. It does not:
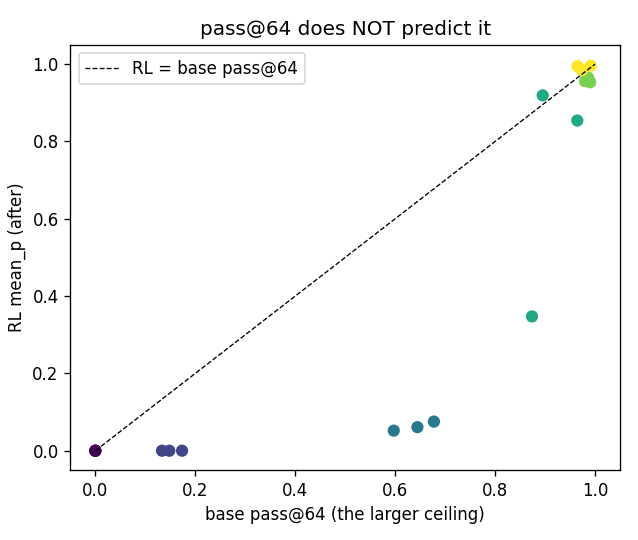
Same dots, same y-axis - only the x-axis is now the base’s pass@64. The dots fall well below the diagonal: every substrate ends up far short of what its own 64 tries could reach. A problem which the base solves 1 out of 30 times might show up when we sample 64, but in a group of 8 there is very low chance of that, and so for GRPO it does not exist. The group is like the harvesting window and capability outside the window might as well not be there.
When does RL help at all?
This panel shows what that implies for the practical question - how much did RL actually improve each substrate? On the x-axis, the target’s weight in pretraining; on the y, RL’s gain in mean p(correct); error bars span the three pretraining seeds:
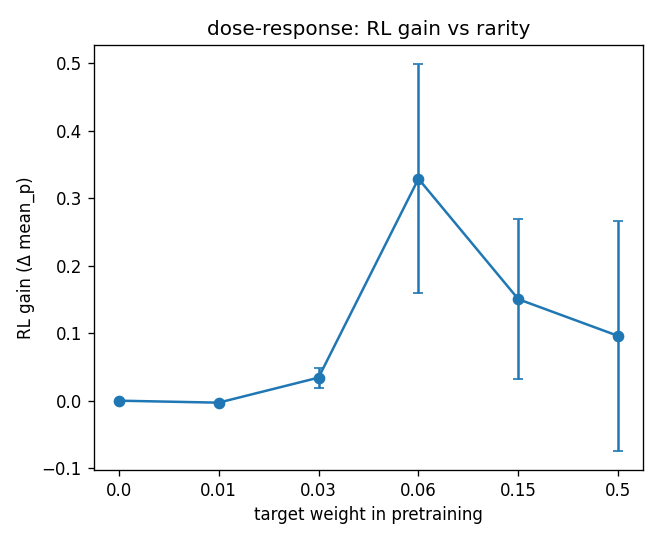
If RL lands at pass@8, then the gain RL can deliver is simply the headroom between where the base starts and where RL ends:
$$\text{RL gain} \;\approx\; \text{pass@8} - \text{pass@1} \;=\; \mathbb{E}_{\text{problems}}\Big[\big(1-(1-p)^{8}\big) - p\Big]$$where p is the base’s exact one-try chance on a problem, and the expectation is over the eval set. Both ends of the hump are explained by this:
- Too rare (weights 0, 0.01): p ≈ 0 on almost every problem, so both terms vanish - pass@8 ≈ pass@1 ≈ 0, and there is nothing to convert.
- Too common (0.15, 0.5): p ≈ 1 on almost every problem, so both terms saturate - pass@1 is already close to pass@8, and there is nothing left to add.
- The peak, at weight 0.06 (~1% of the stream): p sits in between, where the gap between the two terms is widest - lots of “right somewhere in 8 tries” that is not yet “right on the first try”.
We can also find where the gap is largest. For a single problem, $(1-(1-p)^8) - p$ is maximized where its derivative $8(1-p)^7 - 1$ hits zero, i.e. at $p = 1 - (1/8)^{1/7} \approx 0.26$ - a problem the base gets right about 1 time in 4 is perfect for RL to work on.
Interesting part is that the weight 0.06 is exactly the recipe the first post’s substrate was built with - and that substrate sat at 26% greedy on the target, almost exactly the p ≈ 0.26 the formula points at. The competent-but-unreliable regime turns out to be precisely where RL pays best.
At the sweet spot, pretraining luck decides
Notice how the error bars in the hump are widest right at the peak. Zoom into the three pretraining seeds at the 0.06 setting - same data mix, same everything except the pretraining seed:
| seed (0.06 setting) | base one-shot | after RL |
|---|---|---|
| A | 8% | 35% |
| B | 52% | 92% |
| C | 53% | 85% |
Seed A’s substrate came out of pretraining barely able to do the task; seeds B and C came out halfway competent. After identical RL: 35% versus 92%. The sweet spot sits on a sharp jump in how well pretraining happens to work at that rarity.
The RL runs were fine in every case. Each one faithfully converted its base’s pass@8 into first-try accuracy - the dots all sit on the diagonal. Nothing about the 35% run was worse as an RL run; it was handed a worse substrate, and it delivered exactly what that substrate contained. The outcome was decided before RL started.
So when an RL run fails, maybe we should be first looking at what the pretraining supplied it.
Is group size really the dial?
Everything so far had G fixed at 8, so “RL realizes pass@(group size)” rests on one value of the group size. If the claim is right, changing G should move the ceiling itself. So, a causal check: one substrate (the X1 recipe), the same GRPO setup, sweeping only the group size G over 2, 4, 8, 16 and 32 - three seeds each.
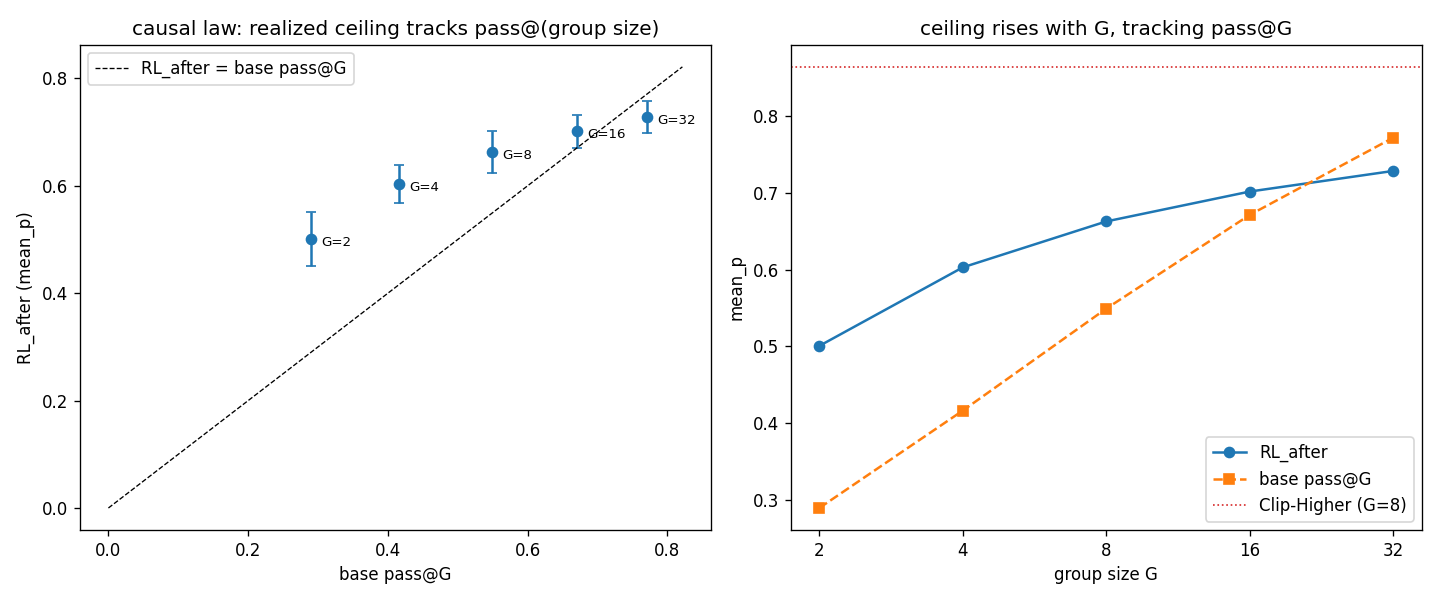
| group size G | base pass@G | RL lands at |
|---|---|---|
| 2 | 0.29 | 0.50 |
| 4 | 0.42 | 0.60 |
| 8 | 0.55 | 0.66 |
| 16 | 0.67 | 0.70 |
| 32 | 0.77 | 0.73 |
The ceiling rises with G, tracking the base’s pass@G. Give GRPO a wider window and it harvests more of the capability distribution.
One nuance though, at small G the points sit above the diagonal - RL beats the base’s day-one pass@G. That is not a contradiction, the policy improves during RL, so later groups are sampled from a better policy. Over 500 updates the policy improves, and later groups are sampled from that improved policy, so the effective window ends up wider than what the base started with. At G = 16 and 32 the window is already wide enough that this effect has little room left, and the points converge onto the diagonal.
There are also diminishing returns: going from G = 16 to 32 doubles the rollout cost but buys only about 3 points.
The red dotted line shows Clip-Higher at G = 8. It reaches ~0.86, higher than any setting in the group-size sweep and close to the base model’s pass@64 (0.85). Clip-Higher is a small tweak from DAPO: instead of clipping both sides equally, it raises the upper clip, allowing a rare correct answer to be reinforced more strongly when it appears in a group. This is just one configuration, but it suggests that how we reinforce answers can matter as much as how many answers we sample.
Takeaways
So, how much can RL extract from a model? My experiments suggest that RL can extract what the base model reaches within its pass@G.
This is not just a result from my tiny setup. Shen et al. found a similar pattern on real models trained on chess and math: post-RL performance can be predicted from pretraining loss alone. My experiment adds a controlled test of why this happens: I varied one thing, reran pretraining 18 times, measured exact probabilities, and found that pass@(group size) is the quantity connecting pretraining to what RL can achieve.
Code and full write-ups for all experiments: sky-2002/Tiny-RLVR.